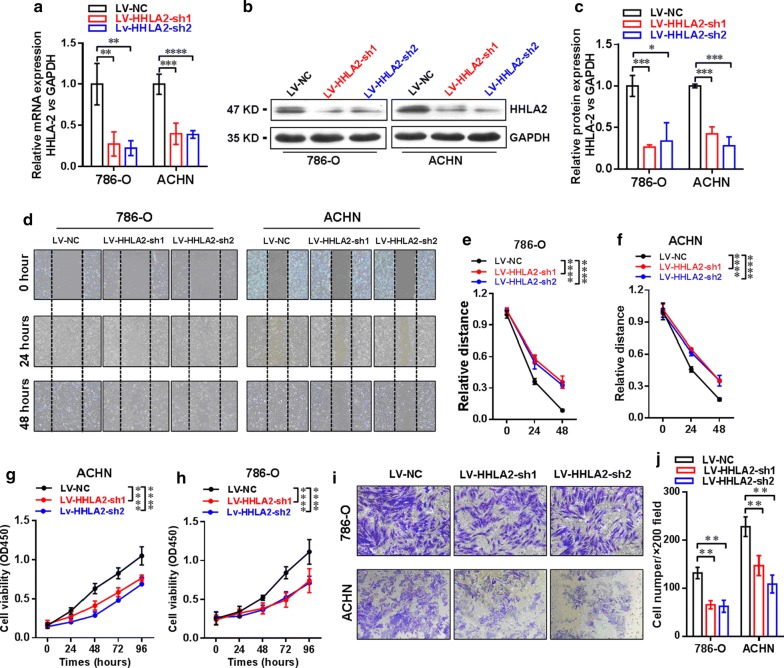
Fig. 3.
Establishment of stable knockdown of HHLA2 expression in ccRCC cell lines 786-O and ACHN. a The knockdown efficiency was confirmed by real-time RT-PCR analysis, and the data showed that the mRNA expression level of HHLA2 was significantly decreased in the LV-HHLA2-sh1 (P < 0.01 in 786-O cells, and P < 0.001 in ACHN cells) and LV-HHLA2-sh2 (P < 0.01 in 786-O cells, and P < 0.0001 in ACHN cells) compared with LV-NC group cells respectively. b, c By using the western blotting analysis, we also confirmed that the HHLA2 expression at the protein level was significantly decreased in the LV-HHLA2-sh1 (P < 0.001 in 786-O cells, and P < 0.001 in ACHN cells) and LV-HHLA2-sh2 (P < 0.05 in 786-O cells, and P < 0.001 in ACHN cells) compared with LV-NC group cells. d–f The migration ability of the ccRCC cell lines after knockdown HHLA2 expression in the LV-HHLA2-sh1 and LV-HHLA2-sh2 groups was examined compared with the LV-NC group cells. At the time point of 48 h, the relative distance of LV-HHLA2-sh1 (P < 0.0001 in 786-O cells, and P < 0.0001 in ACHN cells) and LV-HHLA2-sh2 (P < 0.0001 in 786-O cells, and P < 0.0001 in ACHN cells) was significantly increased compared with the LV-NC group cells. g, h Our CCK-8 assay showed that the cell proliferation ability of ccRCC cell lines was significantly decreased in the LV-HHLA2-sh1 (P < 0.0001 in 786-O cells, and P < 0.0001 in ACHN cells) and LV-HHLA2-sh2 (P < 0.0001 in 786-O cells, and P < 0.0001 in ACHN cells) compared with the LV-NC group cells. i, j Transwell assay showed that the cell invasive ability of ccRCC cell lines was significantly decreased in the LV-HHLA2-sh1 (P < 0.01 in 786-O cells, and P < 0.01 in ACHN cells) and LV-HHLA2-sh2 (P < 0.01 in 786-O cells, and P < 0.01 in ACHN cells) compared with the LV-NC group cells

