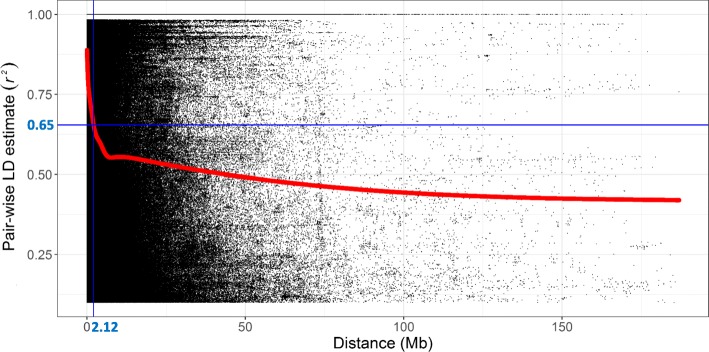
Fig. 4.
Genome-wide average linkage disequilibrium (LD) decay over physical distances based on 44,059 SNP markers. The red curve represents the model fits to LD decay. The blue line represents the half LD decay distance was 2.12 Mb when the LD declined to 50% (r2 = 0.65) of its initial value. Mb, million base pairs

