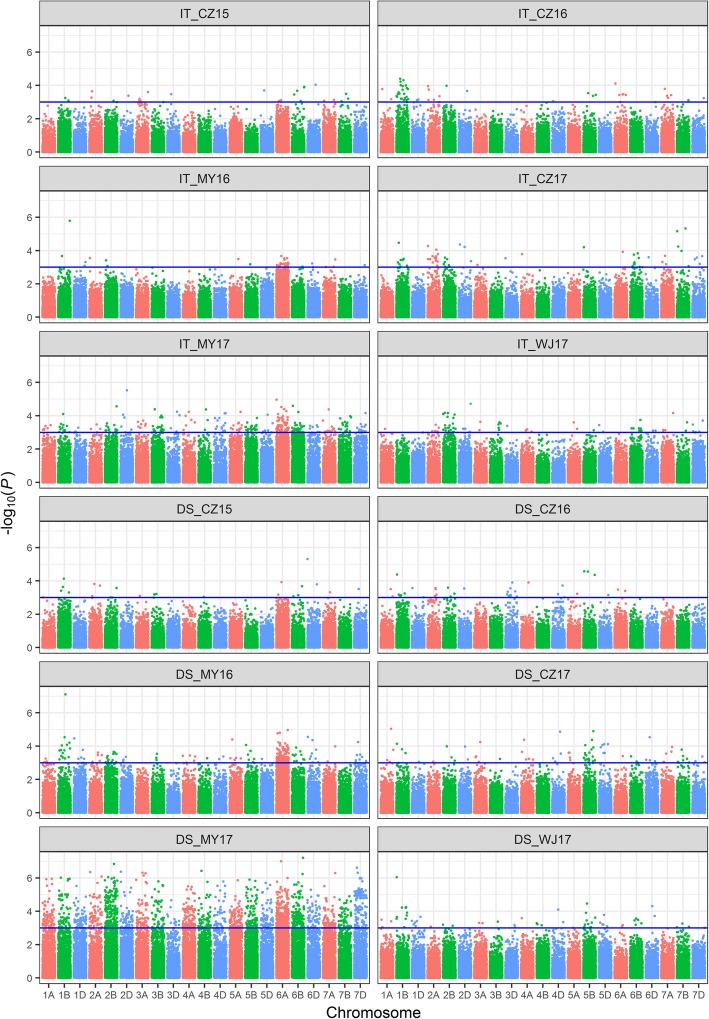
Fig. 5.
The P values of associated loci with infection type (IT) and disease severity (DS) displayed as Manhattan plots. The associated loci with IT and DS in six environments were displayed as Manhattan plots with P values across 21 wheat chromosomes. The significant associated locus was considered as –log10(P) > 3 which upper the blue lines. IT, infection type; DS, disease severity. CZ15 = Chongzhou 2015, CZ16 = Chongzhou 2016, MY16 = Mianyang 2016, CZ17 = Chongzhou 2017, MY17 = Mianyang 2017, WJ17 = Wenjiang 2017

