Figure 2.

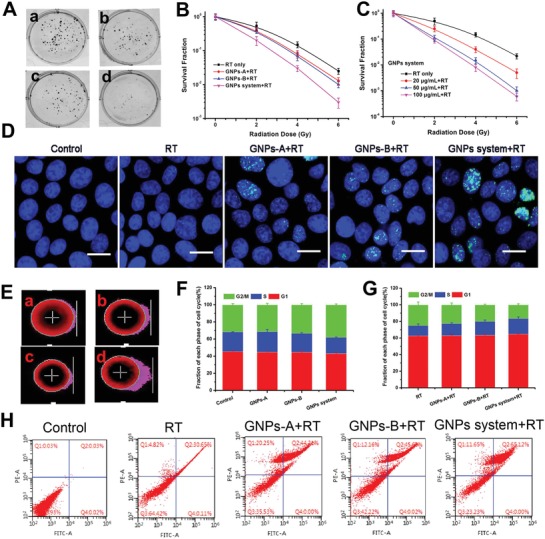
In vitro sensitization efficiency study of GNPs system. Colony formation curves of MCF‐7 cancer cells received various GNPs treatments indicated treated with 6 Gy (A, a: RT only, b: GNPs‐A+RT, c: GNPs‐B+RT, and d: GNPs system+RT). B) Colony formation curves of MCF‐7 cancer cells received various GNPs formulations treated with 0, 2, 4, and 6 Gy. C) Colony formation curves of MCF‐7 cancer cells received various GNPs system concentration treatments treated with 0, 2, 4, and 6 Gy. D) Immunofluorescent imaging of γ‐H2AX foci in MCF‐7 cells incubated with various GNPs treatments under 4 Gy irradiation, scale bar = 25 µm. Imaging of DNA fragmentation by using comet assay after CASP analysis in MCF‐7 cells with different GNPs treatments under 4 Gy irradiation (E, a: RT only, b: GNPs‐A+RT, c: GNPs‐B+RT, and d: GNPs system+RT). Cell cycle distribution histograms of MCF‐7 cells treated with various GNPs for 24 h F) without or G) with 4 Gy irradiation. The data were obtained by flow cytometry using cell cycle detection kit. H) Apoptosis ratios of MCF‐7 cells treated without (control) and with RT only, GNPs‐A+RT, GNPs‐B+RT, and GNPs system+RT after 4 Gy irradiation determined by flow cytometry.
