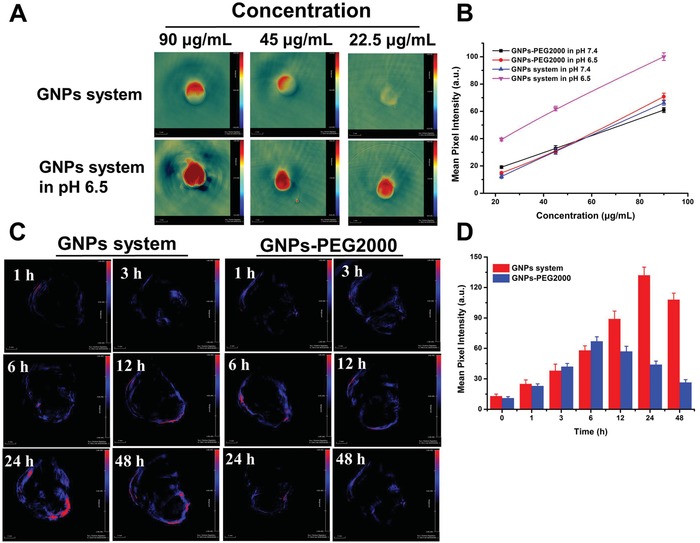
Figure 4.

PA of GNPs system. A) The in vitro PA imaging of GNPs system at concentration of 90, 45, and 22.5 µg mL−1 at pH 7.4 and pH 6.5, respectively. B) The mean pixel intensity of PA signal measured from (A). C) The in vivo PA imaging of GNPs system and GNPs‐PEG2000 after 1, 3, 6, 12, 24, and 48 h intravenous injection, and D) PA intensity of tumor tissue treated with GNPs system and GNPs‐PEG2000 as a function of time.
