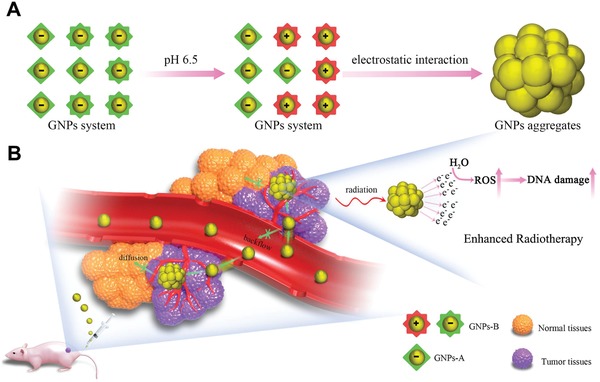
Scheme 1.

A) Diagram depicting the acid‐triggered aggregation and composition of GNPs system. The GNPs‐B undergoes a charge reverse when exposed to acidic environment, where electrostatic interaction further occurs with the GNPs‐A to form aggregates. B) Schematic illustrations of in vivo behavior of GNPs system after intravenous injection for increased tumor retention and enhanced RT.
