Figure 2.

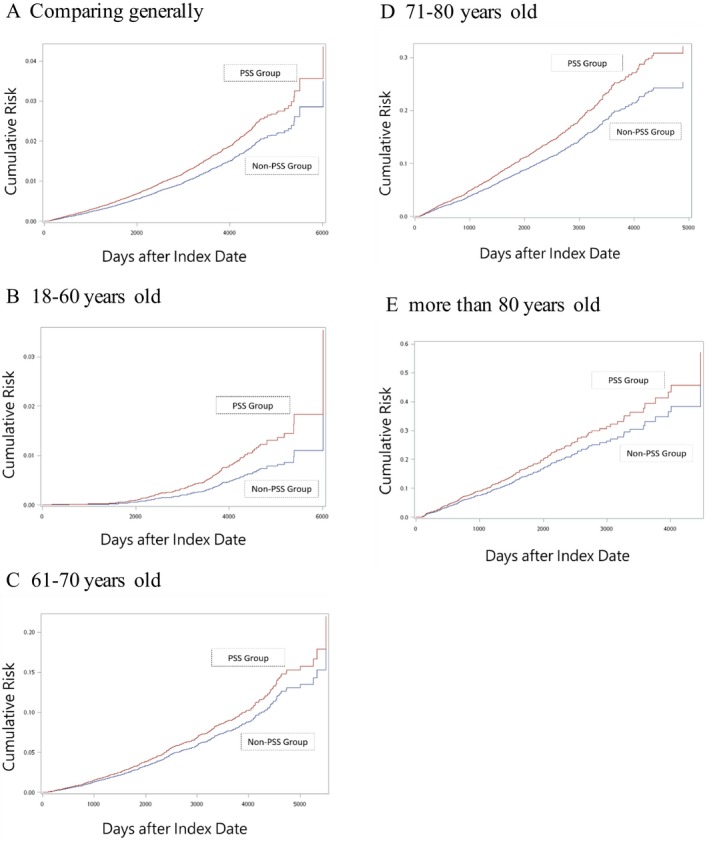
Cumulative incidence plot for the pSS cohort and non‐pSS matched reference subjects, comparing generally (A), and between different age subgroups (B: 18–60, C: 61–70, D: 71–80, and E: more than 80 years old).

Cumulative incidence plot for the pSS cohort and non‐pSS matched reference subjects, comparing generally (A), and between different age subgroups (B: 18–60, C: 61–70, D: 71–80, and E: more than 80 years old).