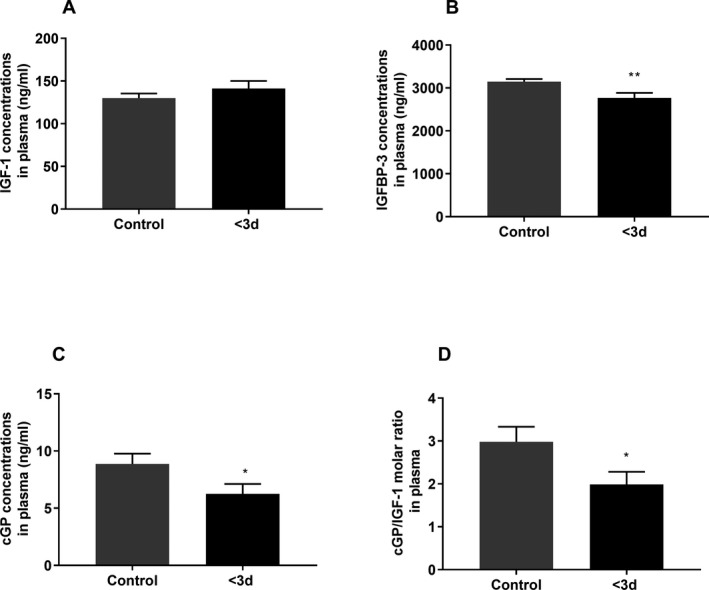
Figure 3.

The differences in biological changes between the control group (n = 48–50) and stroke group at the baseline (<3 days after stroke, n = 34). IGF‐1 concentration did not change after stroke (A). Compared to the control group, the baseline concentrations of IGFBP‐3 (B), cGP (C), and cGP/IGF‐1 ratio (D) were lower in stroke patients. Data presented as Mean ± SEM, *P < 0.05, **P < 0.01.
