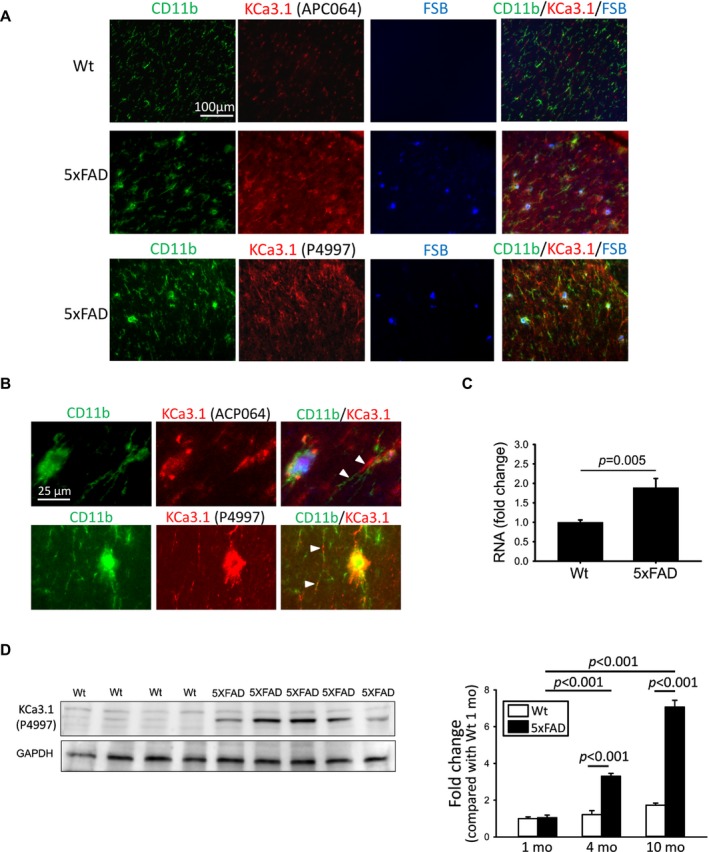
Figure 2.

Microglial KCa3.1 expression is elevated in brains of 4‐ and 10‐month‐old 5xFAD mice. (A) Corresponding coronal sections of mouse frontal cortex from 10‐month‐old mice were fluorescently stained with the amyloid dye anti‐CD11b (green), anti‐KCa3.1 (either APC064 or P4997) (red), and FSB (blue). KCa3.1 was localized to activated microglia enriched around FSB‐positive amyloid plaques. (B) Higher magnification images to illustration localization of KCa3.1 to compartments different from but contiguous to or overlapping with CD11b (white arrowheads) in a 5xFAD brain. Quantitative PCR (C) and Western blotting (D) showed increased cerebral transcript and protein levels, respectively, of KCa3.1 in 5xFAD mice. In (D), the left panel shows a representative Western blot using 10‐month‐old mouse samples, and the right panel shows quantified mean intensities of the KCa3.1 band relative to that of 1‐month‐old Wt mice. Numerical data are presented by mean ± SE and were analyzed by two‐sample t‐test or two‐way ANOVA follow by Bonferroni post hoc test. qPCR (10 mo): Wt, n = 9 and 5xFAD, n = 12; Western blotting: (1 mo) Wt, n = 5 and 5xFAD, n = 5; (4 mo) Wt, n = 5 and 5xFAD, n = 5; (10 mo) Wt, n = 8 and 5xFAD, n = 9.
