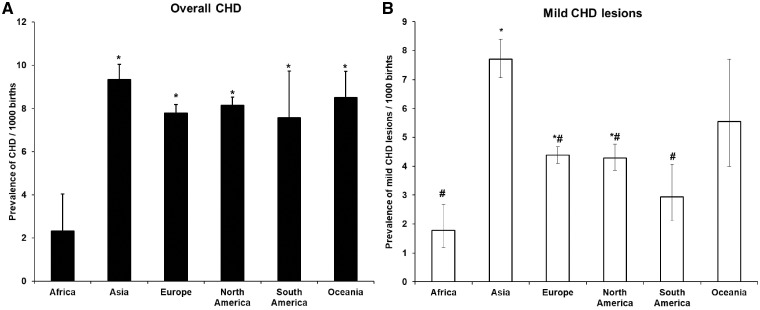
Figure 6.
CHD prevalence in different geographic regions 1970–2017. (A) The prevalence of overall CHD in six geographic regions. (B) The prevalence of mild lesions in six geographic regions. The number of studies for each region was: Africa 4 (69 304 births), Asia 74 (12 975 858 births), Europe 110 (56 272 142 births), North America 58 (59 498 436 births), South America 9 (667 353 births) and Oceania 5 (1 275 758 births). Data for (A) and (B) are presented as Mean ± SE. *, P < 0.05, compared with Africa, #, P < 0.05, compared with Asia.

