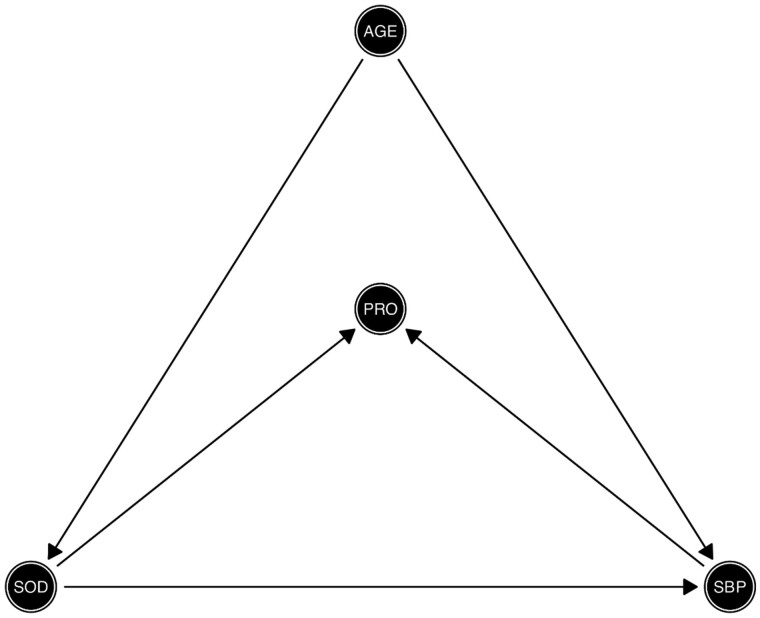
Figure 3.
Directed acyclic graph depicting the structural causal relationship of the exposure and outcome, confounding and collider effects. Exposure: 24-h sodium dietary intake in g (SOD); outcome: systolic blood pressure in mmHg (SBP); confounder: age in years (AGE); collider: 24-h urinary protein excretion, proteinuria (PRO).

