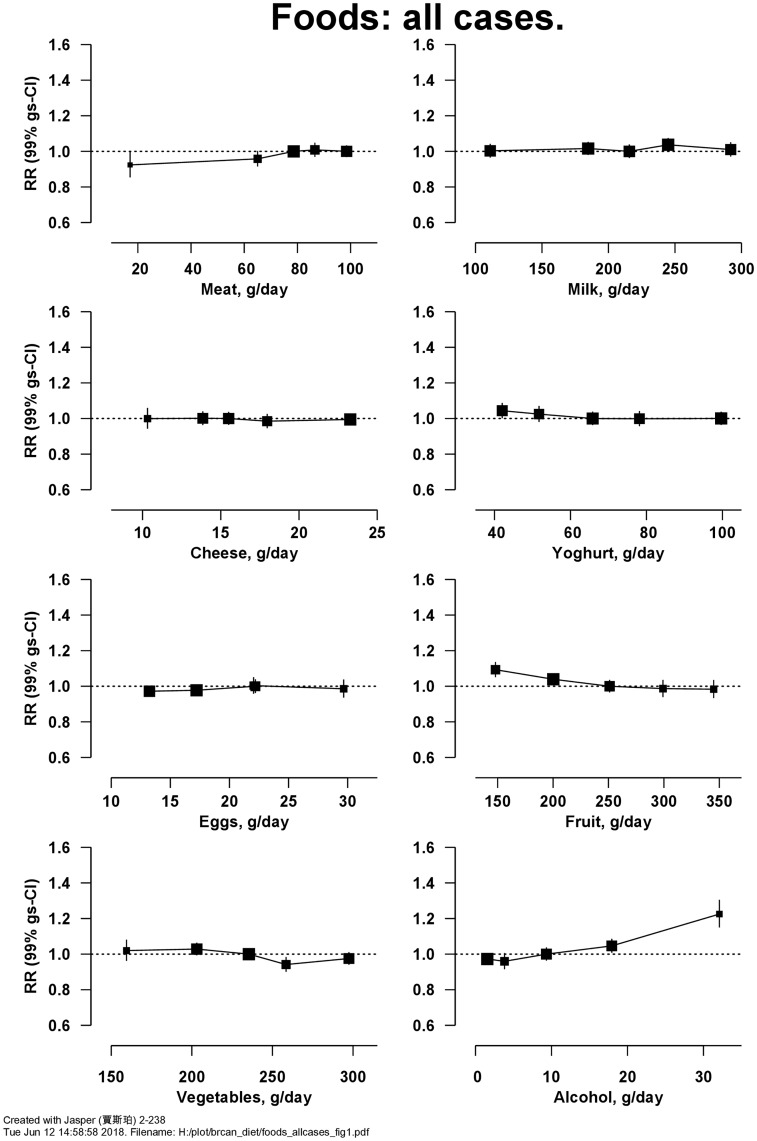
Figure 1.
Relative risk of breast cancer in Million Women Study participants by intake of foods and alcohol. Risks are stratified by region, with attained age as the underlying time variable and adjusted for socioeconomic status, body mass index, height, smoking, current use of hormonal therapy for menopause, dietary energy intake and alcohol consumption (except for the analysis of alcohol and risk). Relative risks (RRs) are represented by squares (with their 99% confidence intervals as lines), each with area inversely proportional to the variance of the log RR, thereby indicating the amount of statistical information for that particular RR.

