
Figure 1.
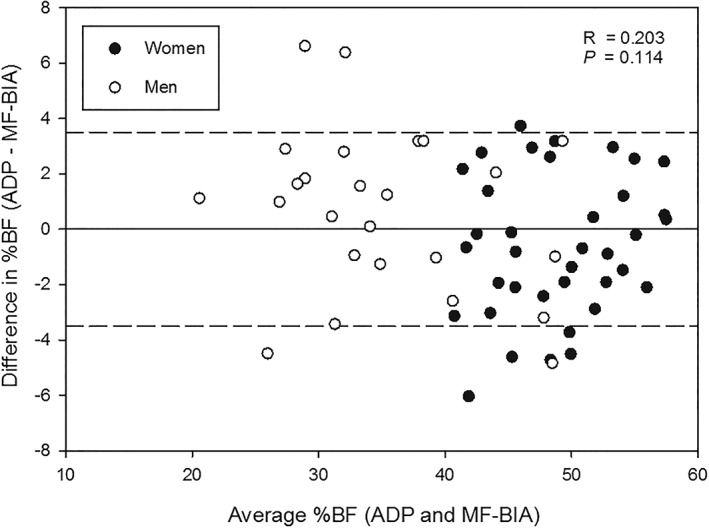
Bland–Altman plot exploring for individual differences in percent body fat (%BF) estimated by air displacement plethysmography (ADP) and multi‐frequency bioelectrical impedance analysis (MF‐BIA). The difference between the two methods is plotted against the average %BF by the two methods in the women (•) and men (◦). The solid line represents no difference between methods, and the dashed lines represent the minimal acceptable standard for prediction errors set at ±3.5%.