Figure 3.

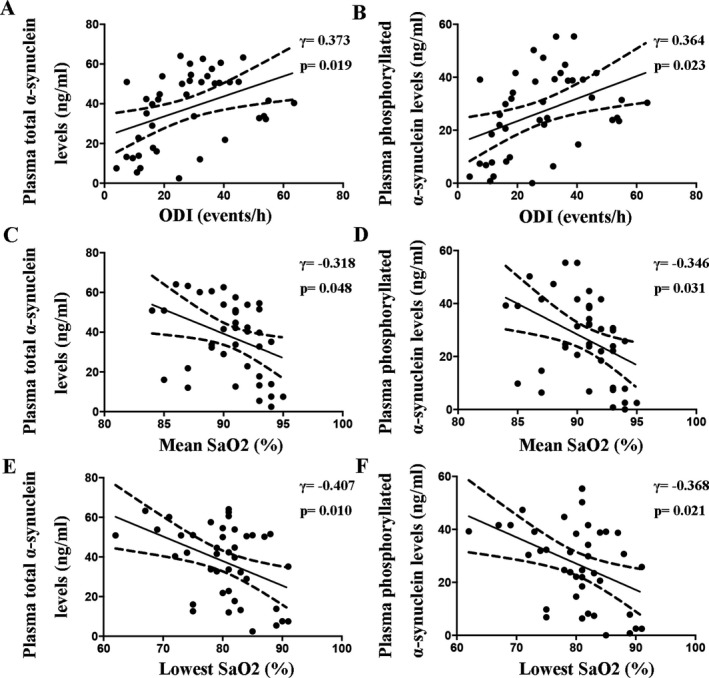
Partial correlations of the plasma α‐synuclein levels with the ODI (A and B), mean SaO2 (C and D), and lowest SaO2 (E and F) in the patients with obstructive sleep apnea syndrome adjusted for age, gender, BMI, and comorbidities.

Partial correlations of the plasma α‐synuclein levels with the ODI (A and B), mean SaO2 (C and D), and lowest SaO2 (E and F) in the patients with obstructive sleep apnea syndrome adjusted for age, gender, BMI, and comorbidities.