Figure 6.
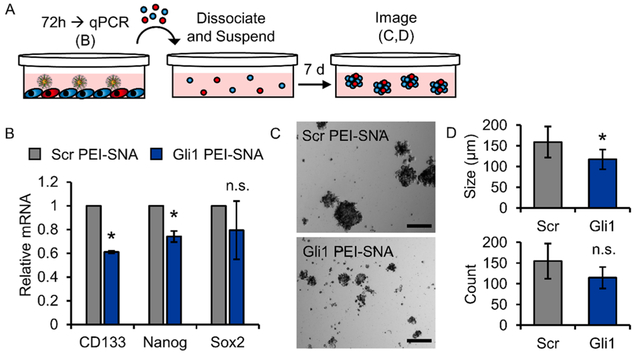
Gli1 PEI–SNAs reduce stemness and impair self-renewal of U87 cells. (A) Schematic depicting the neurosphere culture model and experimental design; red cells illustrate GSCs. (B) qPCR showing expression of genes associated with stemness following exposure to PEI–SNAs. Gene expression is normalized to that of GAPDH. Data are means ± STDs; *p < 0.001 relative to Scr PEI–SNA. (C) Representative bright-field images of neurospheres cultured from U87 cells after exposure to PEI–SNAs. Scale = 200 μm. (D) Gli1 PEI–SNAs reduce the size and number of neurospheres formed, as measured from 25 tiled bright-field images per treatment group per experiment; *p = 0.03 by Student’s t-test.

