
Figure 1.
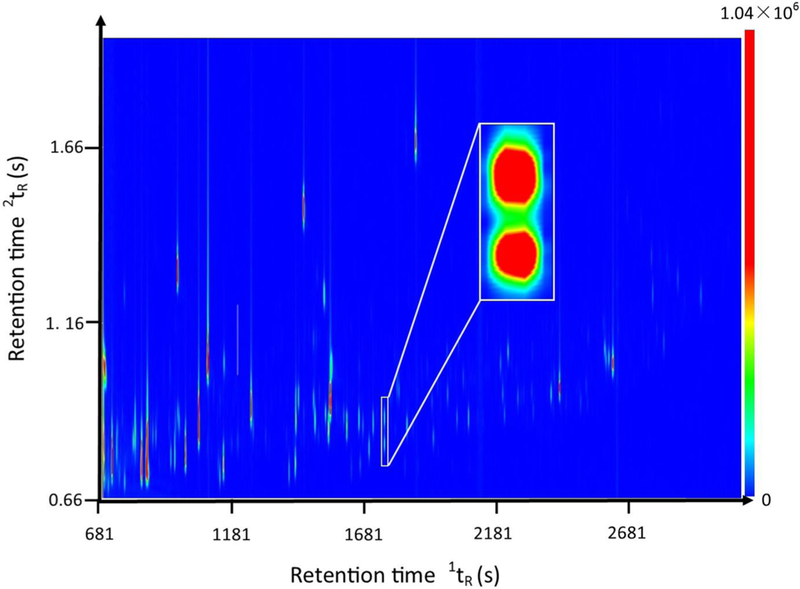
Sample GC×GC-TOF MS chromatogram of metabolites extracted from mouse fecal samples. The x axis is the first dimension retention time 1tR in seconds. The y axis is the second dimension retention time 2tR in seconds. The color bar shows the signal intensity of each peak plotted on the chromatogram in total ion current.