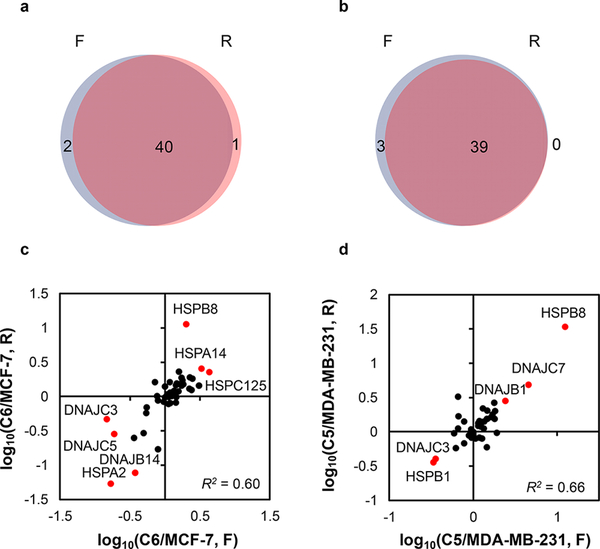
Figure 3.
Analytical performance of the PRM method. Venn diagrams showing the overlap between quantified heat shock proteins obtained from forward and reverse SILAC labeling experiments in paired MCF-7 WT/C6 (a) and MDA-MB-231 WT/C5 (b) cells. Scatter plots displaying the correlation between the ratios obtained from forward and reverse SILAC labeling experiments in paired MCF-7 WT/C6 (c) and MDA-MB-231 WT/C5 (d) cells.

