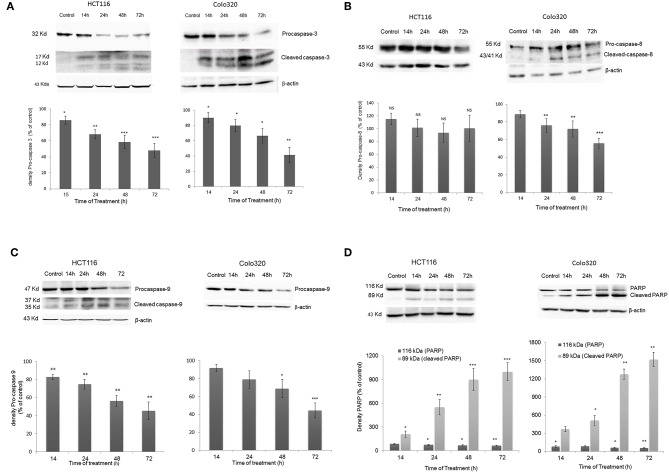
Figure 7.
Activation of Caspases following IV treatment. HCT116 and Colo320 cells were treated with 300 μg/ml IV extract for 14–72 h. and caspase−3 (A), caspase−8 (B), caspase−9 (C), and PARP (D) were detected by Western blot, where β-Actin was used as loading control. Densitometry analysis represents the average expression levels of the pro-caspase and/or the cleaved caspase and PARP; Density values were calculated as a control from the proper β-actin and as a percent of control. Data represented are average of three independent experiments (mean ± SE). Statistical significance was determined by a two-tailed student's t-test (treatment vs. control) and marked as *p < 0.05, **p < 0.01, ***p < 0.001; NS, Not Significance.

