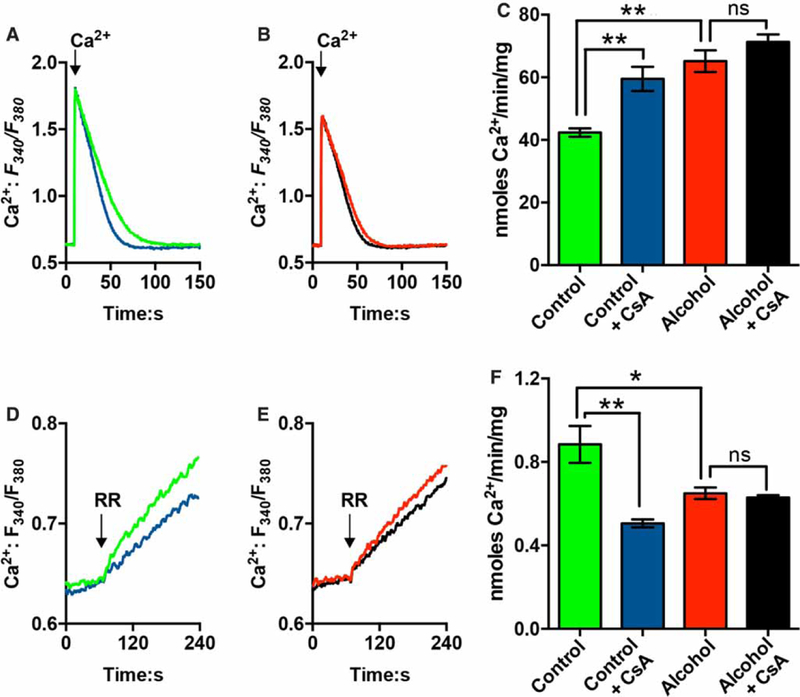
Figure 5. The effects of CsA on mitochondrial Ca2+ handling in hepatocytes from control and alcohol-fed animals.

Mitochondrial Ca2+ uptake (A-C) and Ca2+ efflux (D and E) in permeabilized hepatocytes isolated from control (A and D) or alcohol-fed rats (B and E). Hepatocytes (2.5 mg protein/ml) were digitonin-permeabilized in ICM containing 5 mM glutamate, 1 mM pyruvate, 2 mM ATP, 2 μM fura-2 FF, 1 μM thapsigargin and a protease inhibitor cocktail. Where indicated, CsA (1 μM) was added 5 min prior to data acquisition. (A and B) Representative traces showing mitochondrial Ca2+ uptake in the absence (green and red traces) or presence of CsA (blue and black traces). The arrow shows the addition of 120 nmol Ca2+/mg protein. (C) Summary data for the rates of mitochondrial Ca2+ uptake for the indicated conditions. Data are means ± SEM, n = 5 pairs of control and alcohol-fed rats. (D and E) Cell suspensions were treated with ruthenium red (1 μM, RR) once the Ca2+ pulse (660 nmol) was completely accumulated. This inhibits Ca2+ uptake allowing Ca2+ efflux to be measured. Representative traces showing mitochondrial Ca2+ efflux in hepatocytes from control (D) or alcohol-fed animals (E). CsA was present in the blue and black traces. (F) Summary data for the calculated initial rates of mitochondrial Ca2+ egress. Data are means ± SEM, n = 4 pairs of control and alcohol-fed rats. *P <0.05, **P<0.01.
