
Fig. 13-.
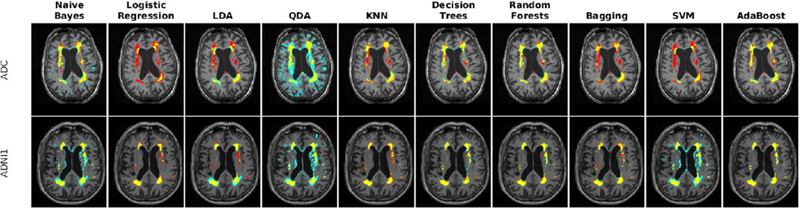
Axial slice comparing manual and automatic segmentations using T1w and T2w information for ADC and ADNI1 datasets. Yellow color indicates regions labeled as WMH in both segmentations, blue color indicates regions only segmented by the automatic technique, and red color indicates regions only segmented by the manual rater.