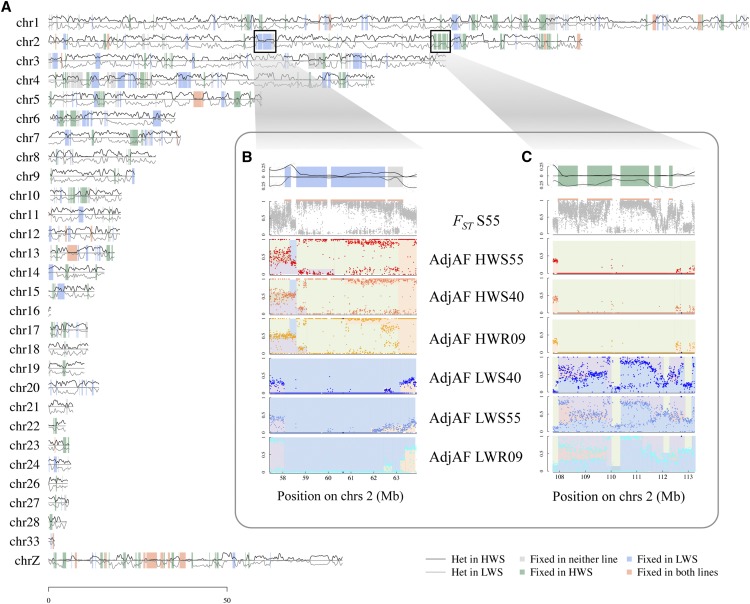
Figure 2.
Heterozygosity across chromosomes of divergently selected Virginia body weight chicken lines. A. Heterozygosity in generation 55 for high weight selected (HWS; black line above x-axis) and low weight selected (LWS; gray line below x-axis) presented across the chicken chromosomes within the differentiated regions shaded using color code: gray where neither line is fixed (); green where only HWS is fixed (); blue where only LWS is fixed within the differentiated region; red where both lines are fixed. B. FST and heterozygosity patterns across chromosome 2:58-63 Mb for selected generations 55 and 40 and relaxed generation 9. C. FST and heterozygosity patterns across chromosome 2:108-113 Mb for selected generations 55 and 40 and relaxed generation 9. Panels within B and C insets: Panel 1: Detail of heterozygosity trace from chromosome map. Panel 2: Mean FST within 1 kb windows between HWS and LWS at generation 55 indicated with gray points; region of differentiation indicated with the orange line above FST plot; allele frequencies of SNP markers with association to body weight indicated with blue diamonds. Panel 3-8: Mean adjusted allele frequency (adjAF) of 5kb windows in HWS generation 55 (HWS55) / HWS generation 40 (HWS40) / high weight relaxed generation 9 (HWR9) / LWS generation 55 (HLWS55) / LWS generation 40 (LWS40) / low weight relaxed generation 9 (LWR9). Shaded colors within these plots have been used to highlight the runs of adjusted allele frequencies that contribute to different haploblocks.

