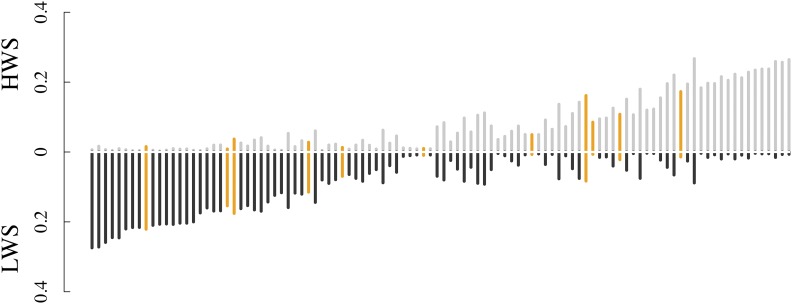
Figure 3.
Mean heterozygosity in HWS (above the x-axis; gray) and LWS (below the x-axis; black) at generation 55 within differentiated regions greater than 0.5 Mb in length. Differentiated regions overlapping known associations with 8-week body weight (Zan et al. 2017) are indicated in orange. Regions presented are sorted in order of increasing cumulative heterozygosity across both lines with increased heterozygosity in HWS.

