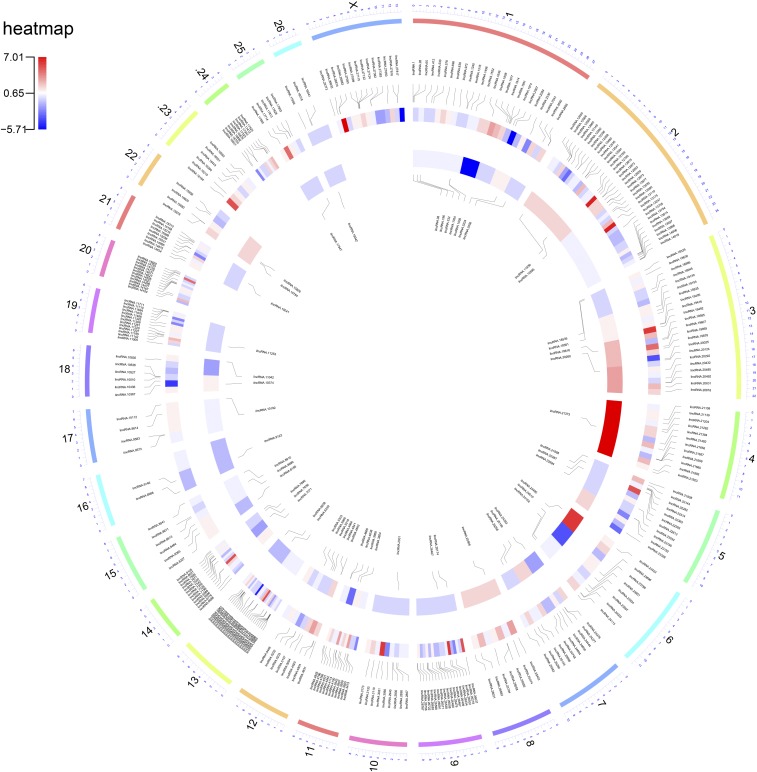
Figure 2.
Circos plot represents the genome-wide distribution density of all the identified novel lncRNAs (in clockwise order). The outer ring of the plot shows the chromosomes, and the central and inner rings exhibit the log2 fold change (Lori-Bakhtiari against Zel) of the novel lincRNAs and ilncRNAs, respectively. Red heatmap colors indicate the higher expression of the gene in Lori-Bakhtiari than Zel breed. Also, the position of the novel lincRNAs and ilncRNAs are shown in the central and inner rings, respectively.

