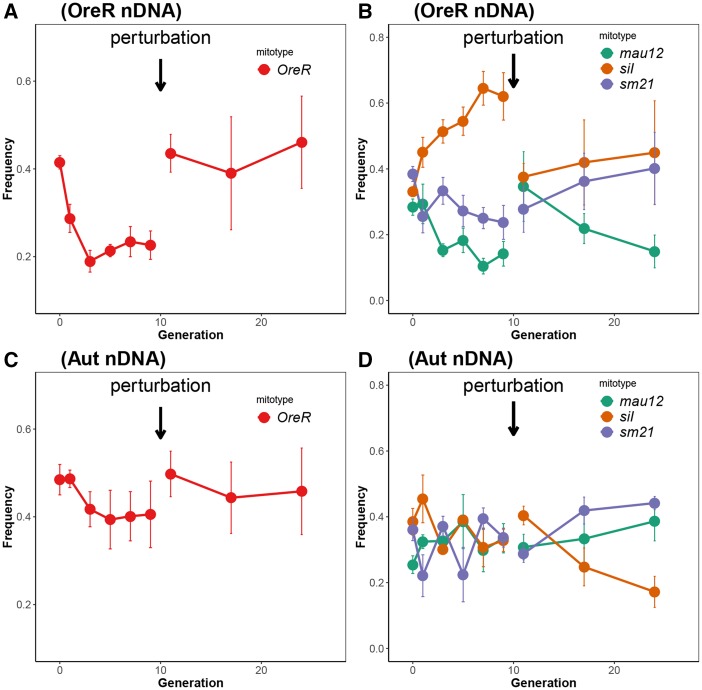
Figure 1.
Frequencies of mtDNAs with different nDNA types as a function of generational time in population cages. (A) shows the pre- and post-perturbation frequency changes for OreR nDNA when the competitor mtDNA types were OreR and Zm53. Only the frequency changes of the OreR haplotype (red line) is shown for clarity. Figure (C) shows the pre- and post-perturbation frequency changes of OreR mtDNAs on the Aut nDNA background. (B) shows the frequencies of D. simulans haplotypes in the pre- and post-perturbation cages on an OreR nuclear background. The figure displays the frequency changes of mau12 (green), siI (orange) and sm21 (purple) haplotypes over generational time. (D) shows the frequency changes of D. simulans haplotypes on an Aut nuclear background. Selection coefficients are reported in Tables 1 and 2. Mean frequencies ± 1 SEM are shown.

