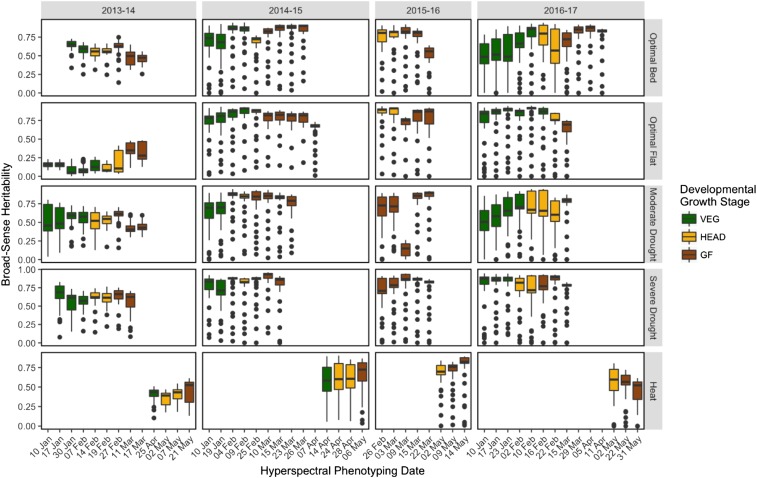
Figure 3.
Broad-sense heritabilities of the hyperspectral wavelengths for each phenotyping time-point within each site-year. Each boxplot represents the distribution of broad-sense heritability values for the 62 hyperspectral wavelengths observed. The colors correspond to the developmental growth stage of the site-year at the time of hyperspectral phenotyping.

