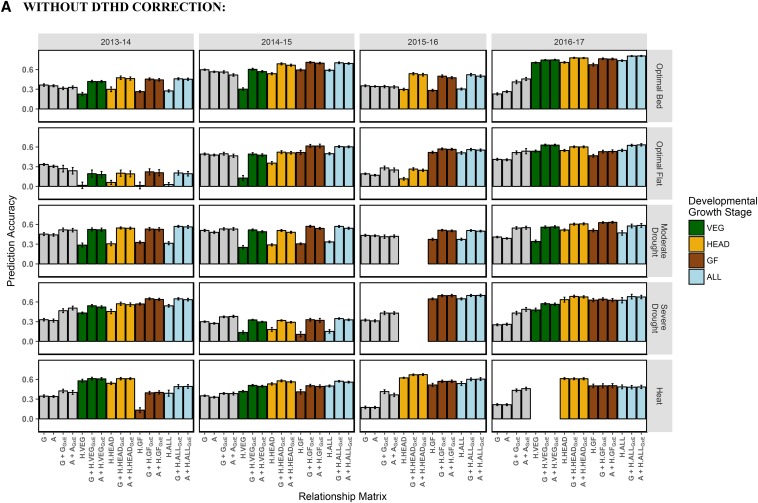
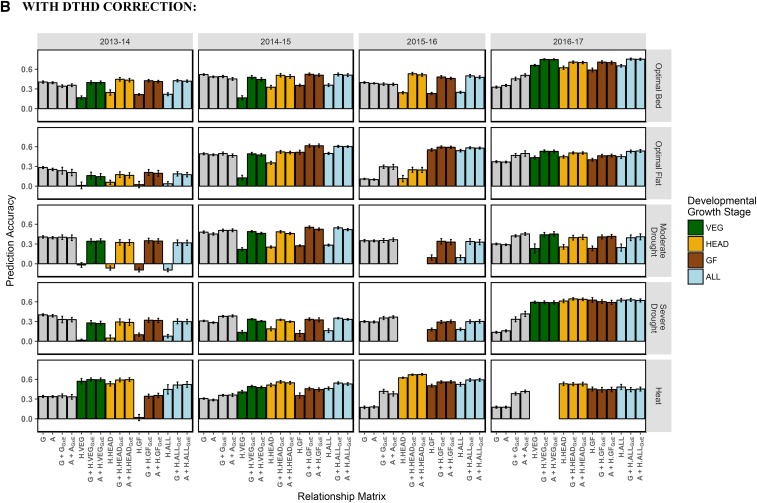
Figure 7.
Within breeding cycle/across managed treatments prediction accuracies, with and without correction for DTHD. Accuracy is expressed as the average Pearson’s correlation between predictions and observed BLUPs for GY across 20 random TRN-TST partitions. In each partition, the TRN set consisted of all records from four out of the five managed treatments within the breeding cycle plus 20% of records from the fifth managed treatment. Single-kernel models tested were genetic main effects only (G or A) and hyperspectral reflectance main effects (H.VEG, H.HEAD, H.GF, H.ALL). Multi-kernel models assessed were genetic main effects plus genetic GxE (G + GGxE, A + AGxE) and genetic main effects plus hyperspectral reflectance GxE (e.g., G + H.VEGGxE, A + H.ALLGxE, etc.). The color corresponds to the developmental growth stage of the site-year at the time of phenotyping. Error bars are the standard deviation of prediction accuracy for the 20 random partitions.


