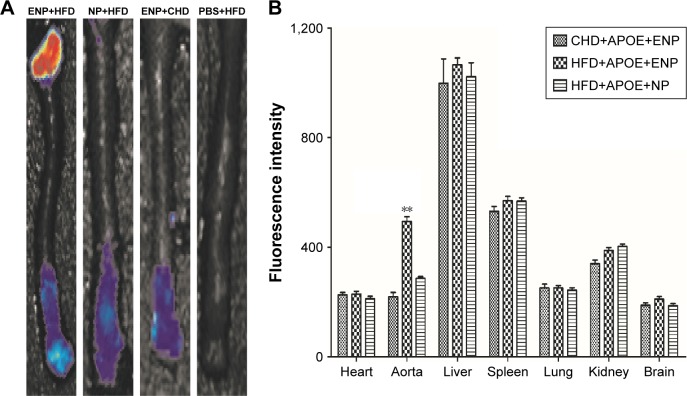
Figure 6.
Organ imaging of DiR-ENPs in atherosclerosis mice.
Notes: (A) Shows the fluorescence imaging of the mouse aorta. (B) Shows the fluorescence intensity of different organs, and the histogram was analyzed by statistical analysis. Data are presented as mean ± SEM (n=6 per group); **P<0.05.
Abbreviations: DiR, 1,1′-dioctadecyl-3,3,3′,3′-tetramethylindotricarbocyanine iodide; ENPs, EGFP-EGF1-conjugated poly(lactic-co-glycolic acid) nanoparticle; SEM, standard error of mean; NP, nanoparticle; HFD, high-fat diet; CHD, normal diet.

