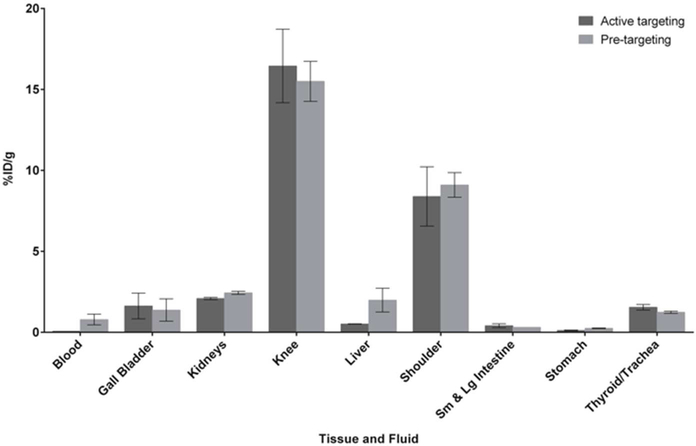
Figure 2.
Biodistribution data for select fluids and tissues for active targeting of 5 combined with 2 (dark bars) prior to administration, and pretargeting (light bars) with 20 mg/kg of 2 administered 1 h prior to 5. Experiments were performed using Balb/c mice (n = 3 per time point) and tissues collected at 6 h post administration of the labeled compounds. Data are expressed as the mean percent injected dose per gram (%ID/g) ± SEM. Full numeric values of both %ID/g and percent ID per organ are found in the Supporting Information.

