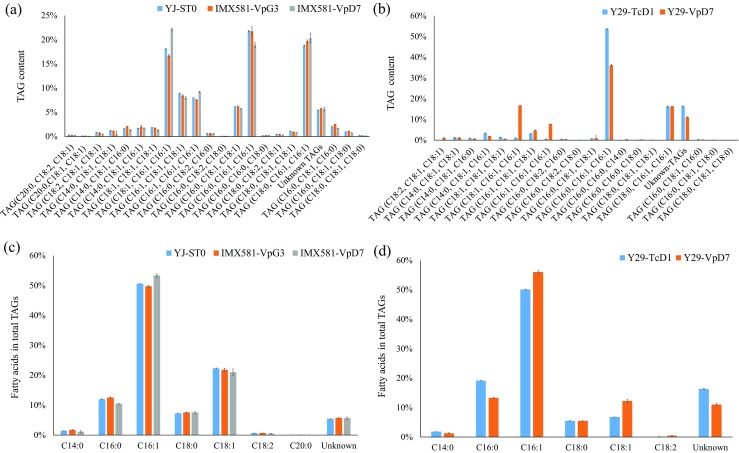
Fig. 5.

Relative TAG content and relative TAG fatty acid composition of S. cerevisiae strains. a Relative TAG content (Area%) of different S. cerevisiae IMX581-derived strains. b Relative TAG content (Area%) of different S. cerevisiae Y29-derived strains. c Relative fatty acid composition (Area%) of the TAGs of S. cerevisiae IMX581-derived strains. d Relative fatty acid composition (Area%) of the TAGs of S. cerevisiae Y29–derived strains. The error bars represent the standard deviation of two biological replicates. Asterisks (*) indicate a significant difference between the yeast strains harboring shea genes and YJ-ST0. “*” indicates p < 0.05; “**” indicates p < 0.01. The p values are calculated based on paired t tests corrected for multiple comparisons
