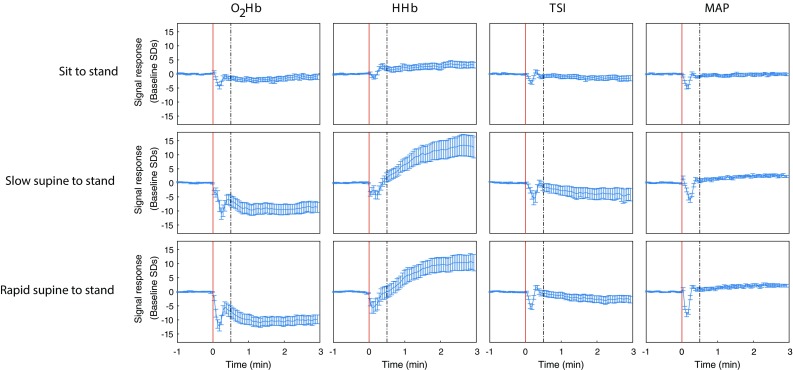
Fig. 2.

O2Hb, HHb, TSI and mean arterial pressure before, during and after standing up as a response to different postural changes, averaged over subjects (n = 15). All signals are unfiltered and normalized at baseline. The red vertical line indicates the onset of the postural change. The dashed line indicates the transition from the early (0–30 s) to the late (30–180 s) interval. The error bars indicate the standardized error of the mean
