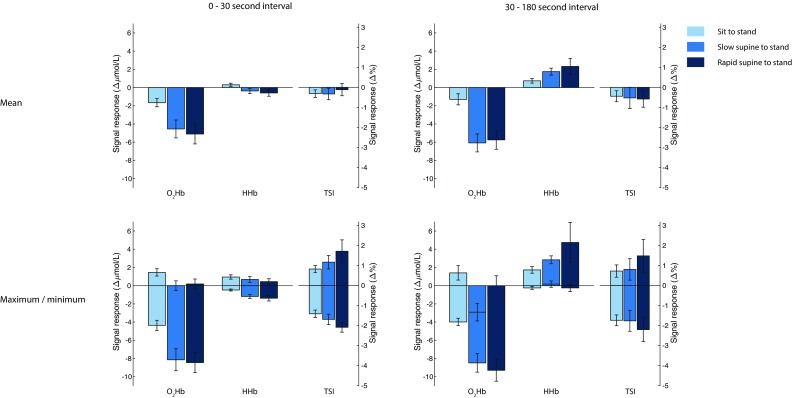
Fig. 3.

Signal response sensitivity of O2Hb, HHb and TSI for different types of postural changes, averaged over subjects (n = 15). The results are computed from the filtered signals. The upper panels depict the mean of the signal within the interval relative to baseline. The lower panels indicate the highest and lowest value (most positive and most negative bar, respectively) within the interval relative to baseline. The error bars indicate the standardized error of the mean. O2Hb oxygenated hemoglobin, HHb deoxygenated hemoglobin, TSI tissue saturation index
