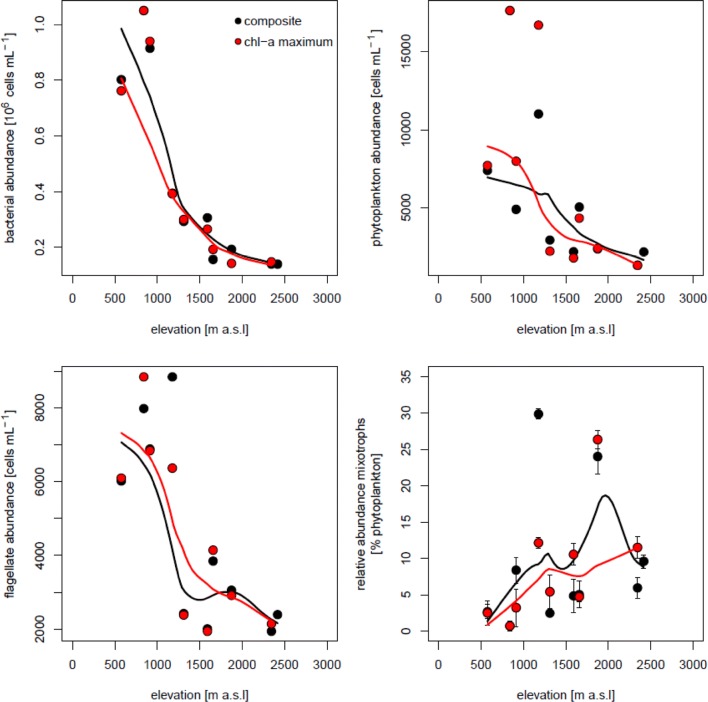
Fig. 2.
Changes in abundance of bacteria, phytoplankton and flagellates and in the relative abundance of mixotrophic flagellates (mixotrophs as percentage of phytoplankton abundance) along the elevational gradient in July. Shown are data for the composite water sample and for the depth of maximum chlorophyll-a concentration. The lines represent locally estimated scatterplot smoothing (loess) fits to the data. Error bars represent ± 1SD for the three parallels in the food tracer experiments

