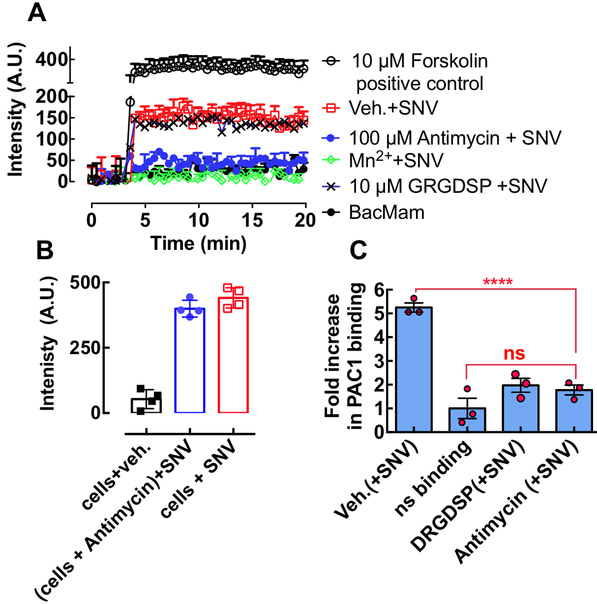
Figure 6.
A. A plot of Green fluorescence of CHO-A24 cells expressing an Upward cAMP Difference Detector in situ (CADDis) sensor, responding to 10 μM forskolin (positive control for cAMP activity) and SNVR18 alone and mixed with 100 μM Antimycin, 1.5 mM Mn2+ and GRGDSP. Error bars represent ±SD for triplicate measurements. B. The plot compares endpoint cyclic AMP signals produced in antimycin treated cells (no wash) and untreated cells (see Fig. S3 for real-time assay). C. SNVR18 binding to αIIbβ3 recapitulates physiologic integrin activation indicated by PAC-1 binding. The graph shows a plot of fold increase over resting cells in PAC-1 staining of CHO-A24 cells after exposure to SNVR18. 5,000 CHO-A24 cells were suspended in 20 μl media containing 1:20 dilution PAC-1 antibody. Select tubes were treated for 30 min with 10 μM GRDGSP. SNVR18 samples were premixed with antimycin to block SNVR18 binding to cells. To induce PAC-1 staining SNV (5,000 particles/cell) were added to the tubes and incubated with virus for 5 min. Cell activation was terminated by placing tubes in ice-cold water. PAC1 was allowed to equilibrate for 30 min. Cells were washed once and read on a flow cytometer. Error bars represent standard error of 3 triplicate measurements. Statistical significance of the difference between the vehicle (Veh) and compound-treated samples was determined by Dunnett multiple comparison t-tests.

