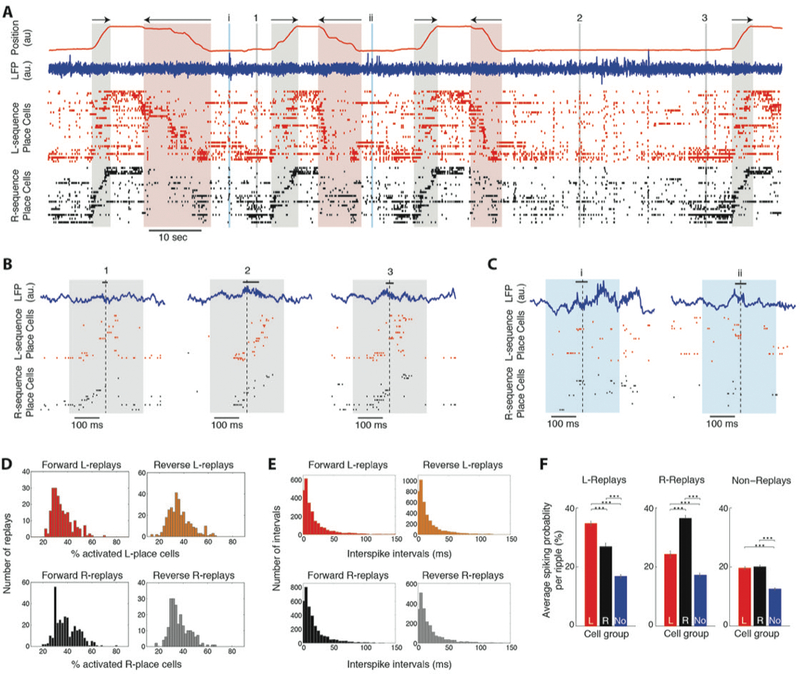
Figure 3:

In vivo sequence replays are dominated by variable spiking patterns of active place cells. A. Position along the linear track (red trace) and direction of motion (arrows) during leftward and rightward crossings (highlighted in red and black respectively). Blue trace: LFP recorded from the CA1 pyramidal layer. Ticks: unit discharges of two pyramidal place cell populations (CA3 and CA1 combined), one encoding leftward crossings (red, ‘L-sequence’; n = 38 cells) and the other rightward crossings (black, ‘R-sequence’; n = 30). Place cells of each sequence are stacked (from top to bottom) according to the location of their place fields on the track (from left to right). Bidirectional place cells were included in both sequences. Colored boxes: LFP ripples detected during immobility at the track platforms. B. Expanded numbered segments (1, 2, 3) in A, displaying examples of forward ‘R-replays’. Black bars: detected ripple segments. Dashed lines: peak power of the LFP ripple (0 ms). C. Expanded latin-numbered (i,ii) segments in A, displaying examples of ‘non-replays’ with uncorrelated or sparse place cell discharges. D. Histograms of percentage of activated place cells (producing at least one spike) during replays of their sequence (all sessions pooled). E. Histograms of time intervals between the first spikes of consecutively activated place cells during replays of their sequence. F. Average spiking probability (% ripples where a cell produced at least one spike) of each cell group during each ripple type (mean ± sem; ‘L’: L-sequence, ‘R’: R-sequence, ‘No’: Non-place cells). Asterisks: p < 0.001, WT-FDR.
