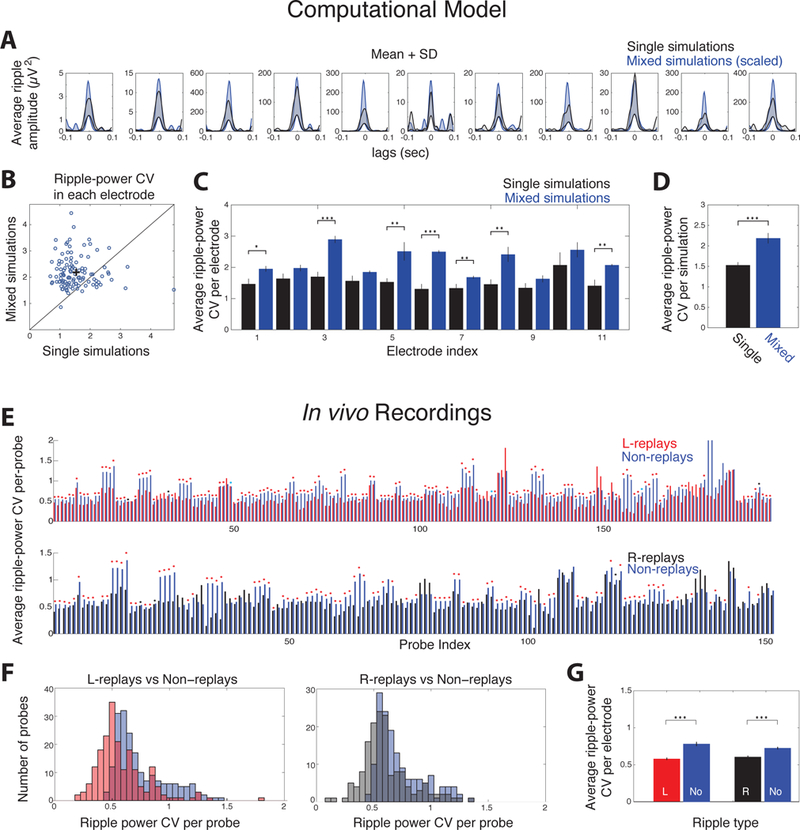
Figure 5:

Activation of place cell ensembles in replays yields robust ripple-amplitudes compared to non-replays. A. Mean+SD ripple-amplitude in each LFP-simulation electrode during a single simulation (black) and a ‘mixed’ one (random ripples from all simulations; blue; scaled so both means have same maximum value). Shaded areas designate the area between mean and mean+SD. B. Ripple-power coefficient of variation (CV) at each site in each individual simulation versus the mixed one. Average CV was significantly higher in mixed simulations (cross; CV = 1.53 and 2.18 for single and mixed simulations respectively; p < 0.001; tailed WT). C-D. Average ripple-power CV at each site over all simulations (C) and over all electrodes (D) for individual (black) and mixed simulations (blue). Asterisks: one: p < 0.05; two: p < 0.01; three: p < 0.001; tailed WT-FDR in C and tailed t-test in D). E. Average ripple-power CV in recording probes containing L-sequence (top) or R-sequence place cells (bottom) in each session. Each probe’s average CV (bootstrapping, n = 500) of L-replays (red) or R-replays (black) is next to the corresponding CV of non-replays (blue). Asterisks: blue, p < 0.05; black, p < 0.01; red, p < 0.001, tailed WT-FDR). F. Distribution of average CV per-probe for L-replays (red) and R-replays (black) compared to non-replay CV (blue). G. Mean CV over all probes (mean ± se) was significantly lower for replays of both sequences compared to non-replays (p < 0.001, tailed WT).
