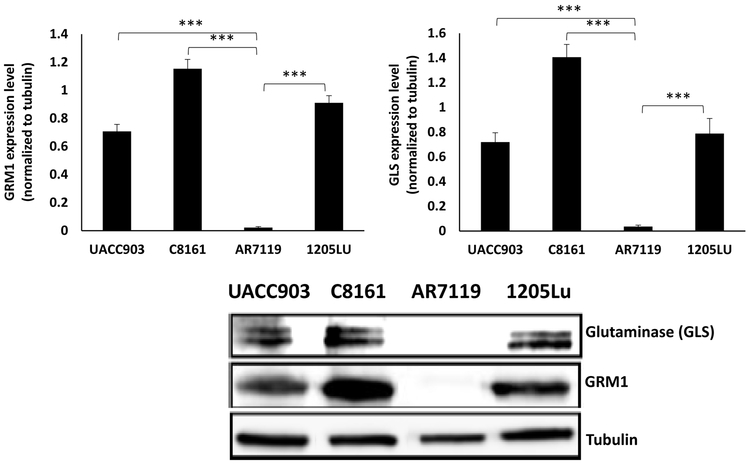
Figure 2: A link between GLS and GRM1 levels in human melanoma cells:
Western immunoblots of metabotropic glutamate receptor 1 (GRM1) and glutaminase (GLS) on protein lysates from three different human melanoma cell lines (C8161, UACC903 and 1205Lu) and one normal immortalized melanocyte cell line, hTERT/CDKR24C/p53DD (AR7119). Lysates were probed with the indicated antibodies. GLS expression correlated with GRM1 levels. Quantification of the intensity of GRM1 and GLS bands normalized to tubulin is displayed above the gel on a bar graph. Data is expressed as a mean ± standard deviation of three independent experiments. Student’s t-test was used to calculate statistical significance. ***p value < 0.05.

