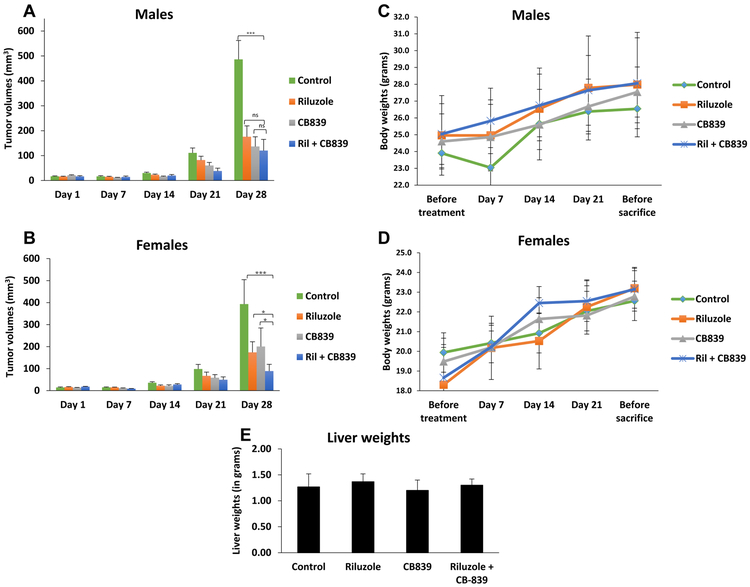
Figure 6: In vivo xenograft tumorigenicity assay:
Xenografts were established in male (n=20) and female (n=20) mice using C8161 cells. The groups were control (vehicle: DMSO + PBS), riluzole (10 mg/kg), CB-839 (200 mg/kg), or the combination of riluzole (10 mg/kg) and CB-839 (200 mg/kg). All agents were given daily by p.o. gavage. All tumor-bearing mice were euthanized after 28 days due to tumor burden in the control (vehicle) group. A two-way ANOVA test with Bonferroni’s post-hoc analysis was used to calculate statistical significance between all treated pairs. Each bar represents volumes of tumors (mean ± standard error), n=5 for each of the 4 treatment groups for males (A) or females (B). Body weight of male (C) and female (D) mice was monitored throughout the course of treatment administration. Liver weights (n=3 for each group) were measured upon termination of the experiment (E). *p value < 0.05, ***p value < 0.001, and ns = no significance.

