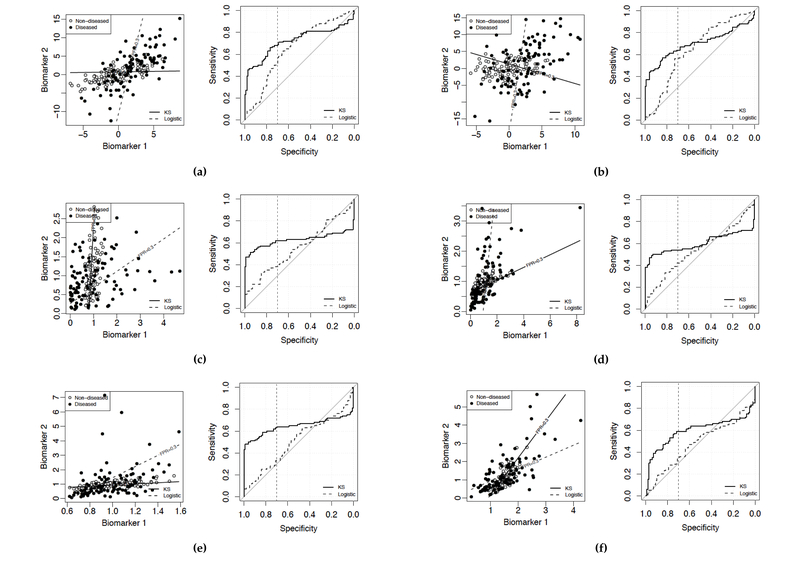
Figure 5.
Scatterplots and ROC plots generated with varying population parameters illustrate that logistic regression is not optimal. Solid lines correspond to the proposed KS method; dashed lines correspond to logistic regression. pAUCs are maximized over the FPR range [0,0.3]. Each straight line in a scatter plot indicates the direction of the classification rule based on the linear combination obtained by the corresponding method, and corresponds to the threshold at FPR = 0.3. The vertical dotted line in the ROC plot indicates 70% specificity. Population parameters used for each scenario are as explained in the description of Figure 4.

