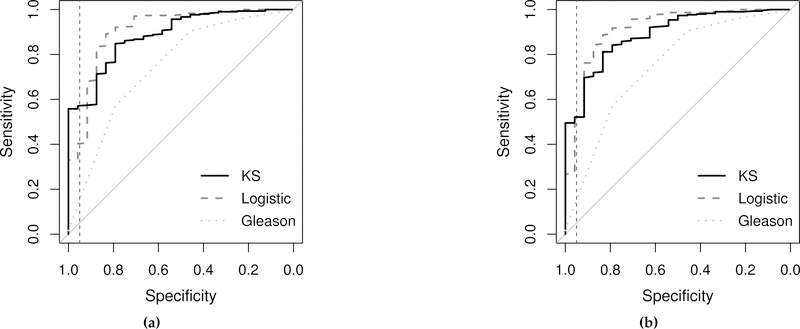
Figure 6.
ROC curves for the RP cohort application plotted with disease status reversed. Black solid lines are the RB-LOO cross-validated ROC curves obtained by the proposed KS method; gray dashed lines are the RB-LOO cross-validated curves obtained by logistic regression; gray dotted lines are the ROC curve for Gleason score. The vertical dashed line in each plot is drawn at 95% specificity. The RB-LOO cross-validated pAUCs are summarized in Table 2. Biomarkers included in each subplot are (a) Subset a) (β-values) + Gleason score; (b) Subset a) (M-values) + Gleason score.

