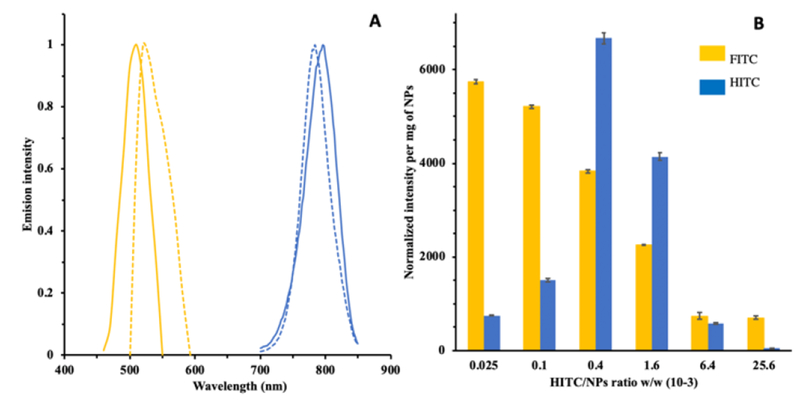
Fig.3.
A) Emission fluorescence spectrum of HITC-FITC NPs and their free fluorophores, respectively. FITC emission peak from HITC-FITC NPs (yellow solid line); free FITC emission peak (yellow dot line); HITC emission peak from HITC-FITC NPs (blue solid line); free HITC emission peak (blue dot line). B) Fluorescence intensity for FITC and HITC of HITC-FITC NPs vs. different amount of HITC added during encapsulation. FITC fluorescence intensity was measured at excitation/emission of 470/510nm, and HITC was at 760/796nm. All samples were prepared in DI water.

