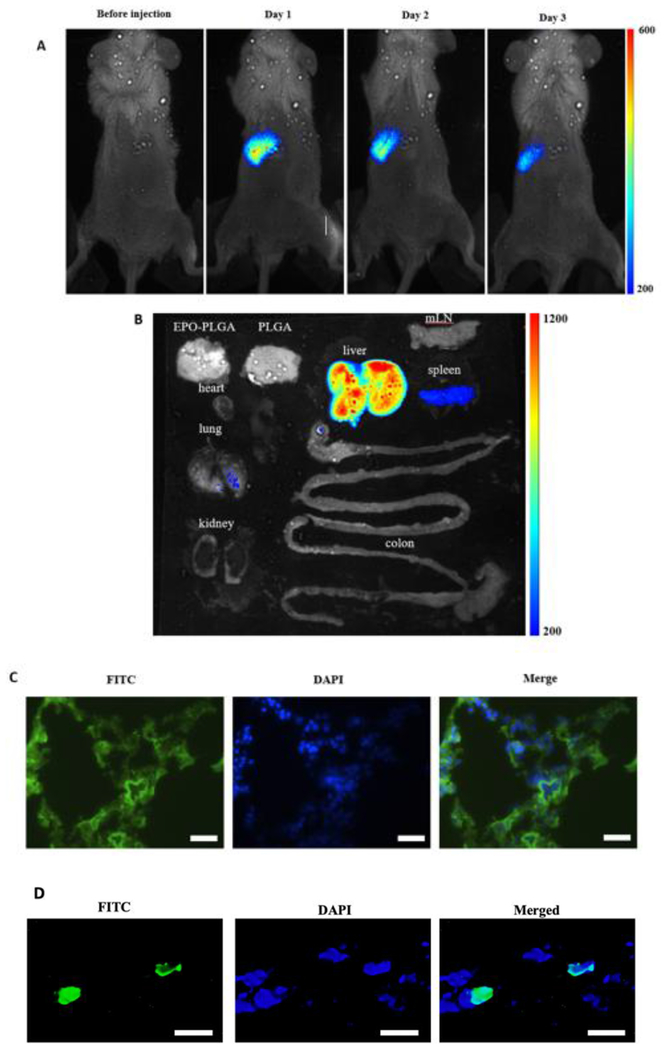
Fig.8.
In vivo imaging of HITC-FTIC-NPs labeled cancer cells. A) HITC-FITC NPs labeled esophageal cancer cells (KYSE-30) were monitored using Kodak In-Vivo Imaging System for 3 days. Cells accumulated near left ribs of the mouse. B) Biodistribution test showed that most of the NPs labeled cancer cells accumulated at the liver while some deposit in the spleen and the lung after 3 days. Both of in vivo images and biodistribution were taken with excitation wavelength at 760nm and emission wavelength at 830nm. C) Fluorescent microscope images of lung sections were taken under FITC (NPs, green) and DAPI (nucleus, blue) channels. (The scale bars indicate 400μm). D) Higher magnification fluorescent microscope images of lung sections were taken under FITC (NPs, green) and DAPI (nucleus, blue) channels. (The scale bars indicate 10μm)

