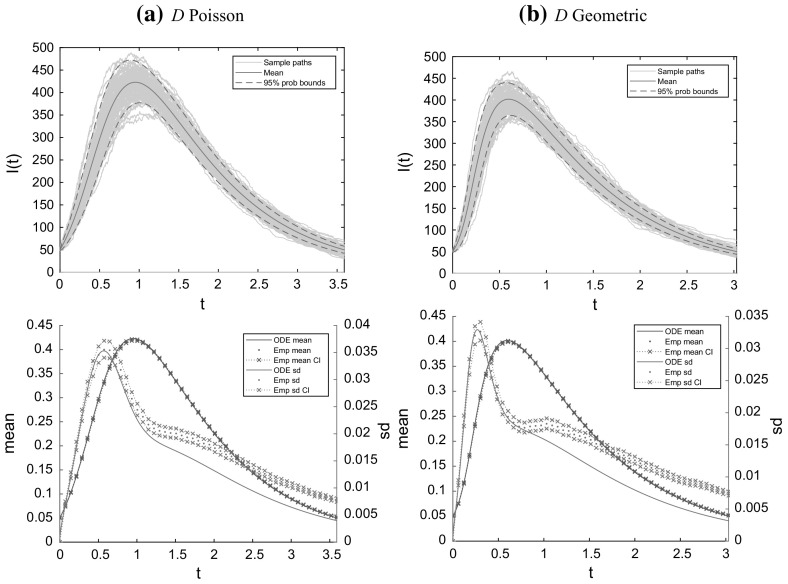
Fig. 1.
Demonstration of approximation implied by Theorem 7.2, for a and b. The upper plots show 100 simulated sample paths of the number of infectives against time t, together with the mean and central 95% probability bands for predicted by the functional CLT. The lower plots show asymptotic values and estimates from 1000 simulations of the scaled mean and standard deviation of the number of infectives through time. Other parameters are , , , , (All plots are truncated at the time when the proportion of individuals that are infective drops below 0.05)

