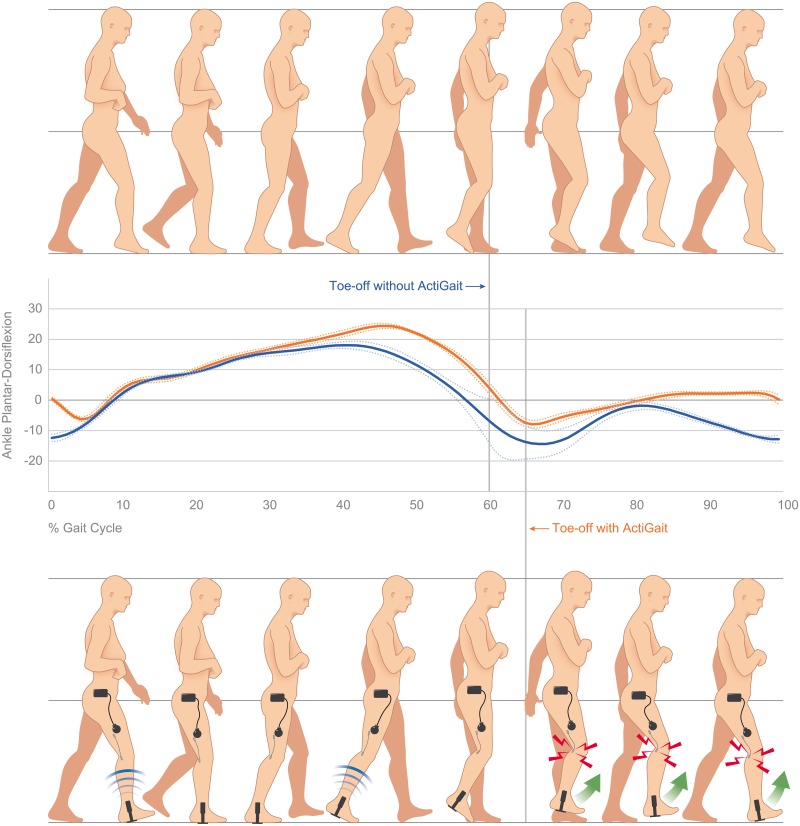
Fig 4. Visualization of the kinematics of the ankle joint in one patient during walking without electrical stimulation (illustration at top, blue line) at baseline and with ActiGait after one year (illustration at the bottom, orange line).
The more impaired leg is presented as the right leg: Without electrical stimulation (blue line), the patient does not have the ability to actively extend the ankle at the end of swing phase, which results in a drop foot and an initial contact with toes first. Additionally, the large standard deviation after toe-off without electrical stimulation indicates an unstable movement pattern when lifting the leg. In contrast to that, the patient is able to maintain dorsal extension of the ankle during swing phase with ActiGait (orange line) and the initial contact is with the heel. This is closer to the healthy norm.

