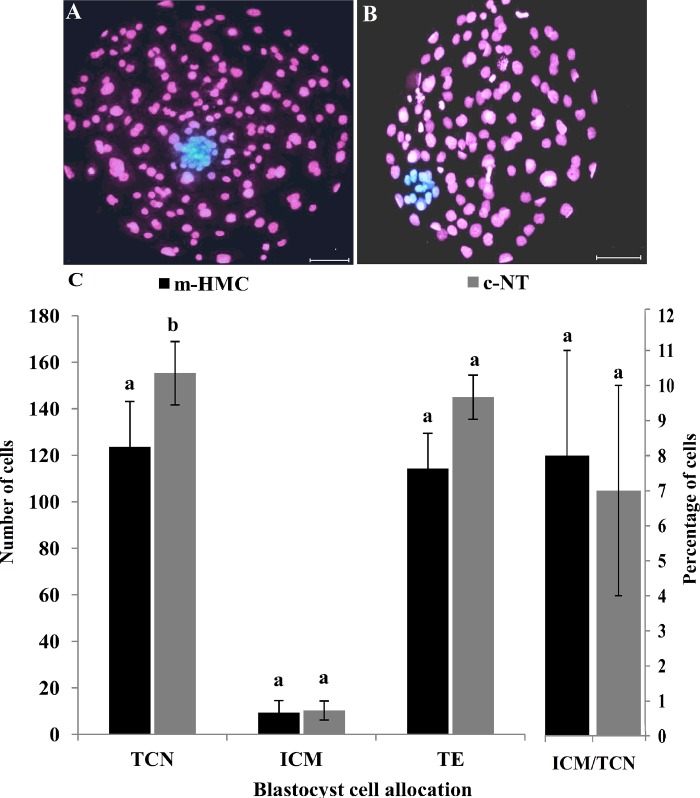
Fig 5. Effect of SCNT method on blastocyst cell number and differential cell allocation.
Differential staining images of D-7 blastocysts produced by m-HMC (A) and c-NT (B) methods. Statistical comparison of total cell number (TCN), inner cell mass (ICM) and trophectoderm (TE) counts and ICM/TCN percentages between blastocysts in m-HMC and c-NT. Different letters indicate significant differences (P<0.05). Bar = 40 μm.

