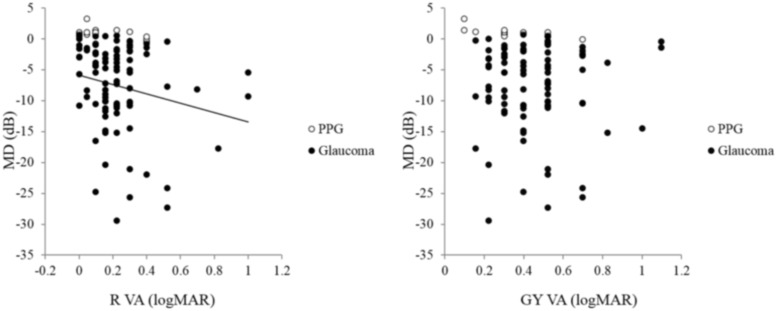
Fig 4. Relationship between mean deviation (MD), red (R) visual acuity (VA) and green-yellow (GY) VA in preperimetric glaucoma (PPG) and glaucoma subjects.
R VA was significantly correlated with MD in the eyes with PPG and glaucoma (r = -0.23, P = 0.02, left), but GY VA was not (r = -0.09, P = 0.37, right).

