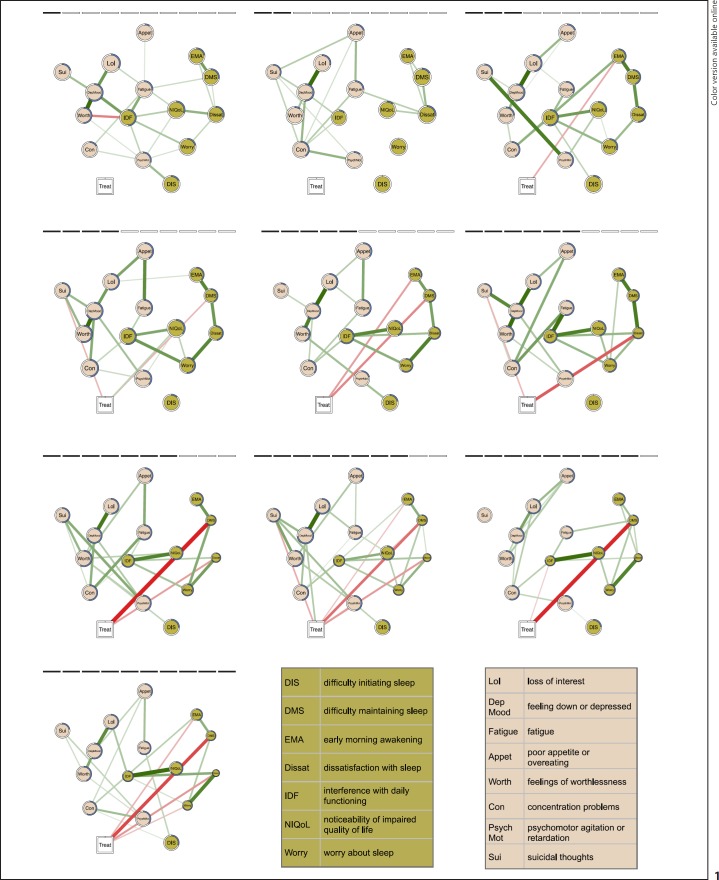
Fig. 1.
The estimated regularized networks correspond to the 10 assessment weeks (2 before treatment (T0, T1), 5 during treatment (T2–T6), 3 after treatment (T7–T9); left to right, top to bottom). The networks include the Insomnia Severity Index and Patient Health Questionnaire items (circles) and treatment (square). The edges represent the conditional dependence relations among the variables that capture the unique associations among the variables, while controlling for all the other variables in the network. Green edges represent positive associations, red edges represent negative associations, and the thickness and color saturation of the edge is proportional to the strength of the association. The size of the node is proportional to the difference in symptom severity between the treatment and control group, where smaller node sizes represent greater differences in favor of the treatment group. For each node, the proportion of explained variance by the other nodes in the network, i.e., the predictability, is visualized by a ring around each node: a completely filled ring indicates that 100% of the variance is explained, a completely empty ring corresponds to an explained variance of 0%. Treatment is directly related to “early morning awakenings” (T2, T4, T7, T9), “difficulty maintaining sleep” (T3, T4, T6–T9), “suicidal thoughts” (T3, T5), “dissatisfaction with sleep” (T5–T7, T9), “psychomotor agitation” (T7)*, or “worry about sleep” (T9). * Note that this edge is partly obscured by the edge between treatment and “dissatisfaction with sleep.” However, a small edge was retrieved in the network.

