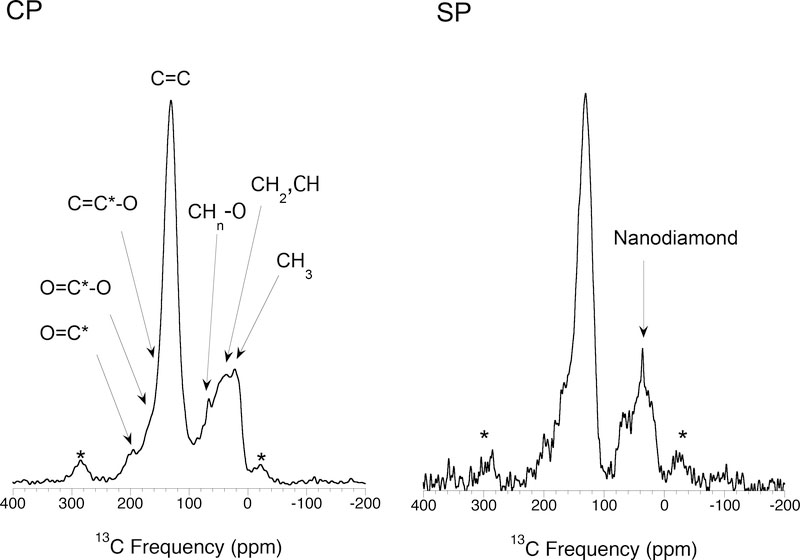
Fig. 8.
Comparison of CP and SP 13C NMR spectra of Murchison IOM (Cody and Alexander, 2005). The signal-to-noise of the SP spectrum is lower than for the CP spectrum, but within the uncertainties they are the same. This shows that the CP spectrum was collected under conditions where all functional groups have similar detection efficiencies and that, except in the nanodiamonds, little of no C is so far from a H that it is not detected by the CP technique (i.e., there are no large PAHs present).

