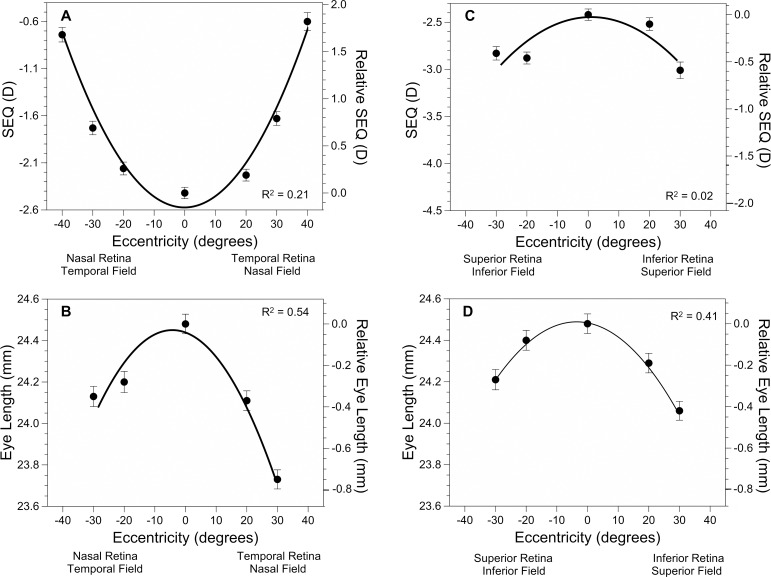
Figure 2.
Plots of both absolute and relative peripheral refraction (A) and absolute and relative peripheral eye length (B) in the horizontal meridian and absolute and relative peripheral refraction (C) and absolute and relative peripheral eye length (D) in the vertical meridian. Error bars represent the standard error of the mean. The best-fit parabola is shown for each. The equations for horizontal peripheral refraction and eye length, respectively, are y = 0.0012 x2 + 0. 0009 x − 2.57 and y = −0.00059 x2 − 0.0056x − 24.44. The equations for vertical peripheral refraction and eye length, respectively, are y = −0.00054 x2 + 0.0008 x − 2.44 and y = −0.00040 x2 − 0.0026x − 24.49. Each term is significantly different from 0 (P < 0.001) except for the linear term for peripheral refraction. The model R2 was computed by squaring the correlation between predicted and observed values.

