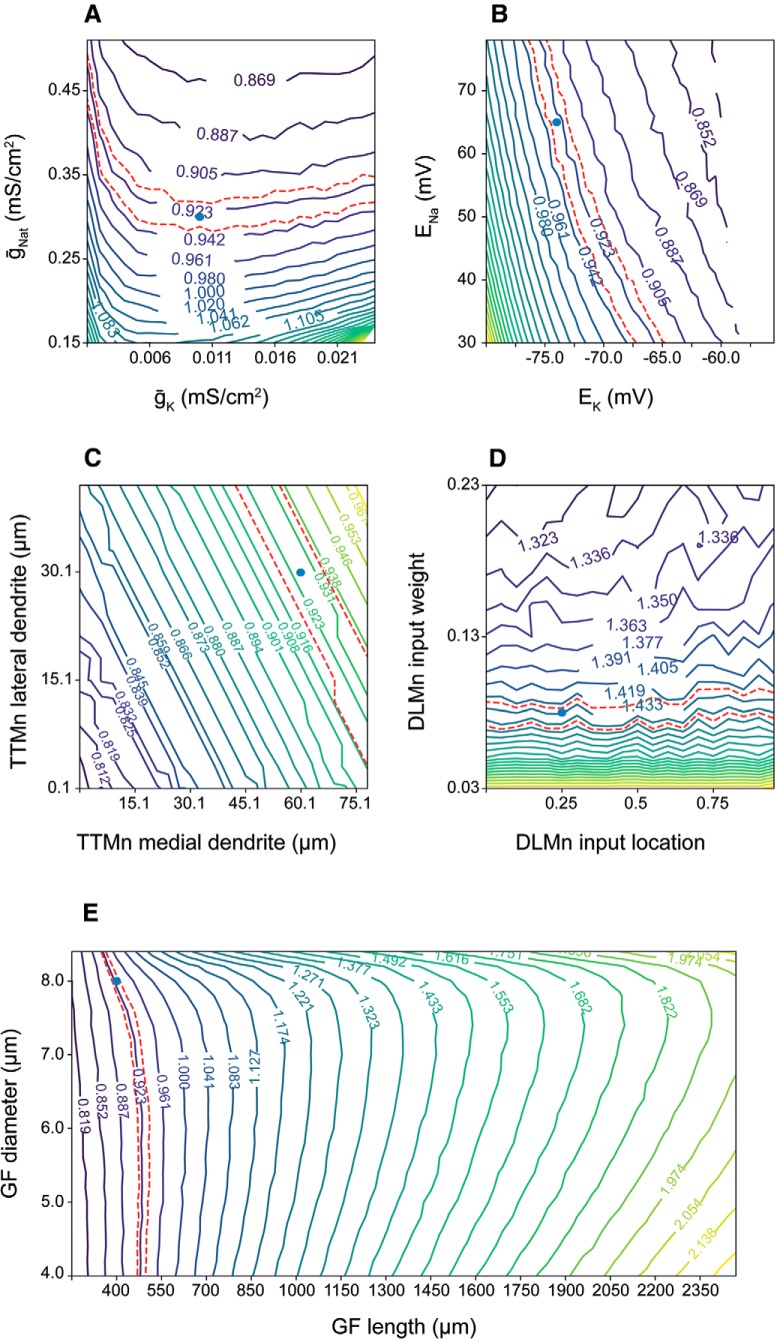
Figure 5.
Co-dependency of the response latency on different parameter combinations. A, TTM latency as a function of maximal voltage-gated transient sodium conductance (ḡNat) and maximal voltage-gated potassium conductance (ḡK). B, TTM latency as a function of sodium reversal potential (ENa) and potassium reversal potential (EK). C, TTM latency as a function of the TTMn medial dendrite length and TTM lateral dendrite length. D, DLM latency as a function of the PSI-to-DLMn chemical synapse weight, and the synapse location along the DLMn dendrite. E, GF latency as a function of the GF diameter and length. Blue dots represent the values for young and old flies, respectively.

