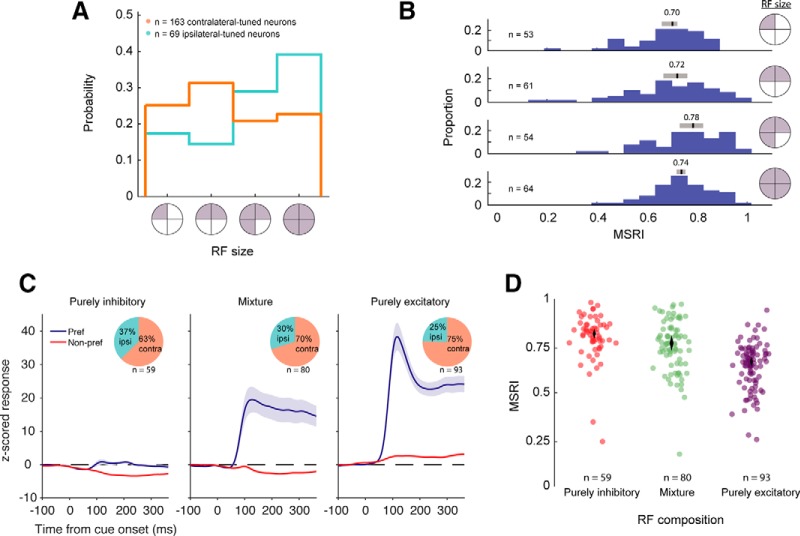
Figure 4.
Receptive field properties. A, Distributions of receptive field sizes (number of quadrants) for ipsilateral and contralateral neurons. A quadrant of the visual field was classified as being part of a unit’s receptive field if a singly presented stimulus in that quadrant elicited a response (excitatory or inhibitory) different from pre-stimulus baseline. B, Corresponding MSRI of units with a given receptive field size. Medians (black vertical lines) were computed using 10,000 bootstrap samples, and gray bars indicate the central 95% CIs of the distribution of medians. CIs for top row: [0.65,0.72], second row: [0.66,0.76], third row: [0.73,0.81], and fourth row: [0.71,0.76]. C, Receptive field configurations. Singly presented stimuli may either excite or suppress neuronal activity relative to baseline. Thus, the receptive field of a given neuron can be (1) purely inhibitory, (2) purely excitatory, or (3) a mixture of both. Neuronal responses (z-scored to baseline) were combined for each of the three possible groups. Preferred responses were the responses to stimuli which elicited the greatest response (or the stimuli which elicited the least amount of suppression, in the case of the purely inhibitory RFs). Non-preferred responses are the average response to the three stimuli, excluding the preferred stimulus. Insets show proportion of ipsilateral-tuned and contralateral-tuned cells in each group. D, MSRI of units with RF compositions shown in C. MSRI was greater in units with a greater proportion of inhibitory receptive quadrants. Each dot is one single unit. Dots are horizontally jittered with reduced opacity for clarity. Vertical length of diamonds are 2.5th and 97.5th percentile CIs of the bootstrapped distributions (10,000 samples) of medians. CIs for purely inhibited cells: [0.79,0.83], cells with a mixture of excited and inhibited activity: [0.73,0.79], and purely excited cells: [0.64,0.68].

